Our work
12 projects · 4 directions
Evidence, made visible. Built for the people who decide.
Case studies across four directions: from live BI systems and executive decks to maps and AI-built tools.
01 · 3 projects
Dashboards & information systems
Monitoring and BI systems that consolidate operational data into one live view for managers and analysts.
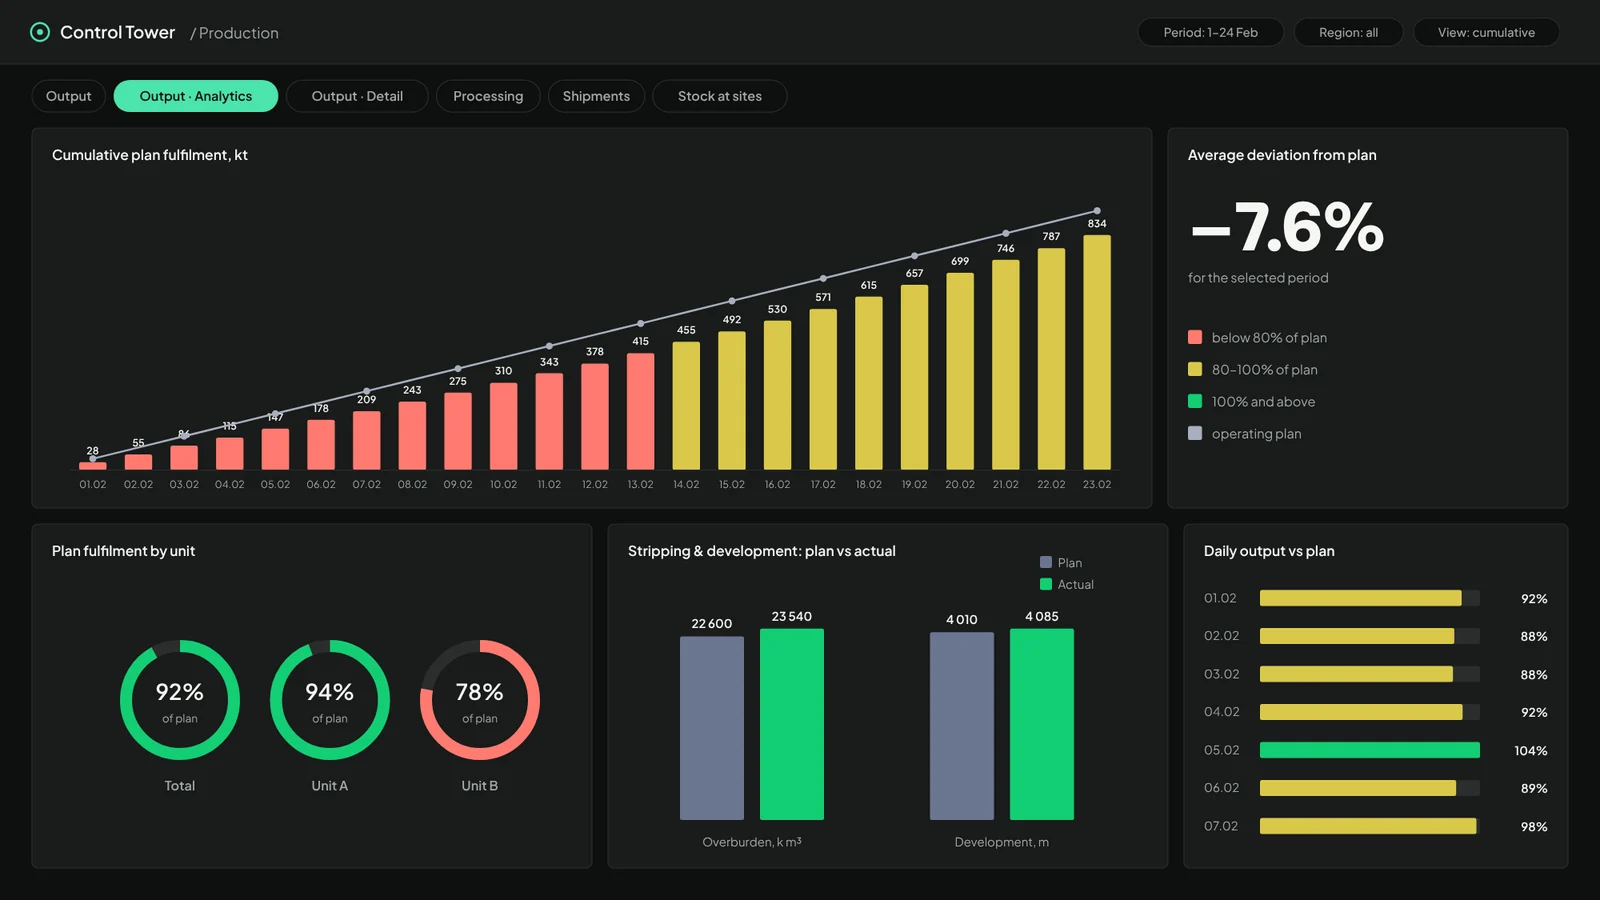
Supply-chain Control Tower
A management-reporting system for the whole supply chain: more than 10 source systems, over 100 KPIs and six business domains in one live view, on desktop and mobile.
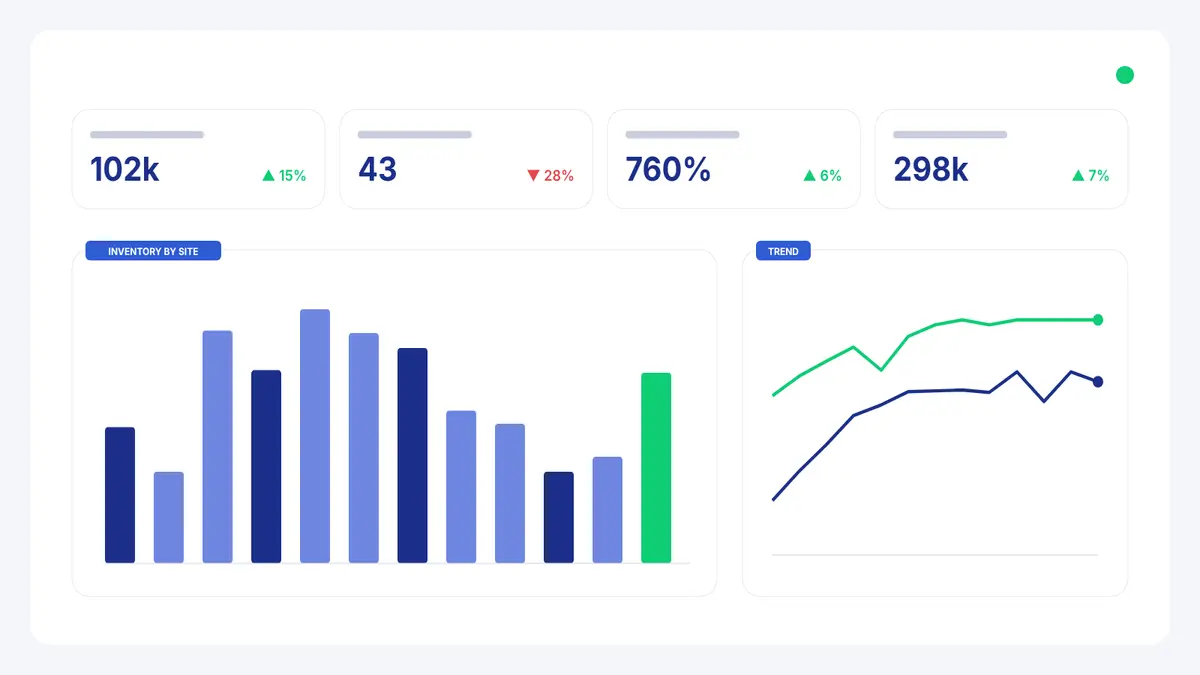
Stocks in Ports
An analytical dashboard giving a complete, accurate picture of inventory held in ports for better planning and resource management.
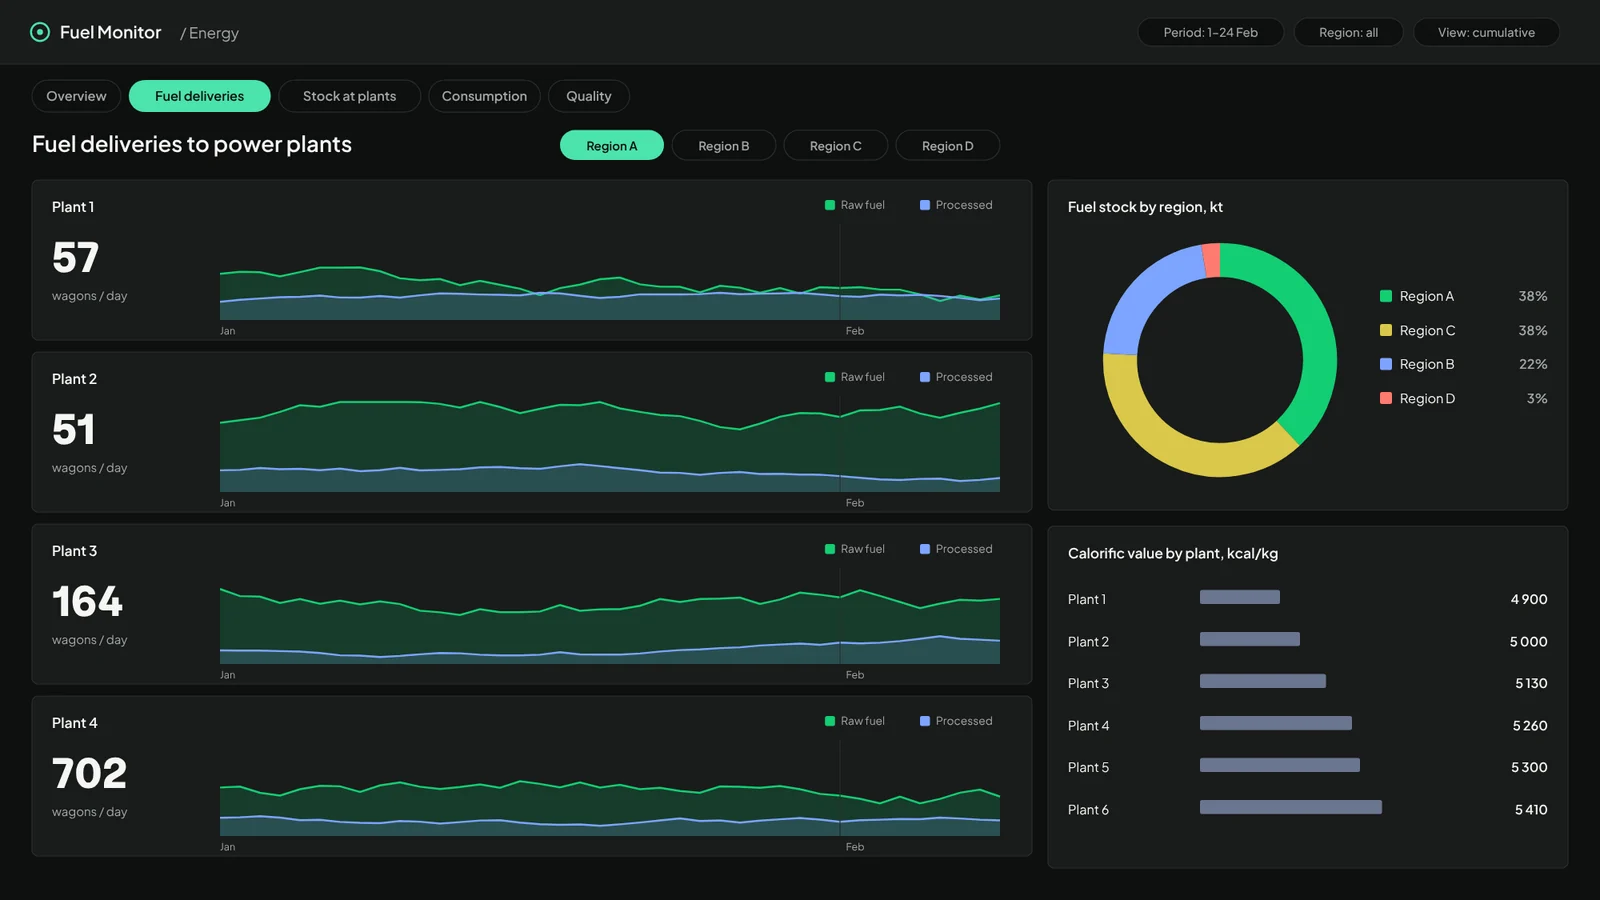
Fuel flows to power systems
Automated tracking and visualisation of how fuel moves to, and is consumed by, the company's power systems.
02 · 3 projects
Presentations & reports
Research findings, analytics and corporate stories structured into decks that executives, partners and conference audiences can follow.
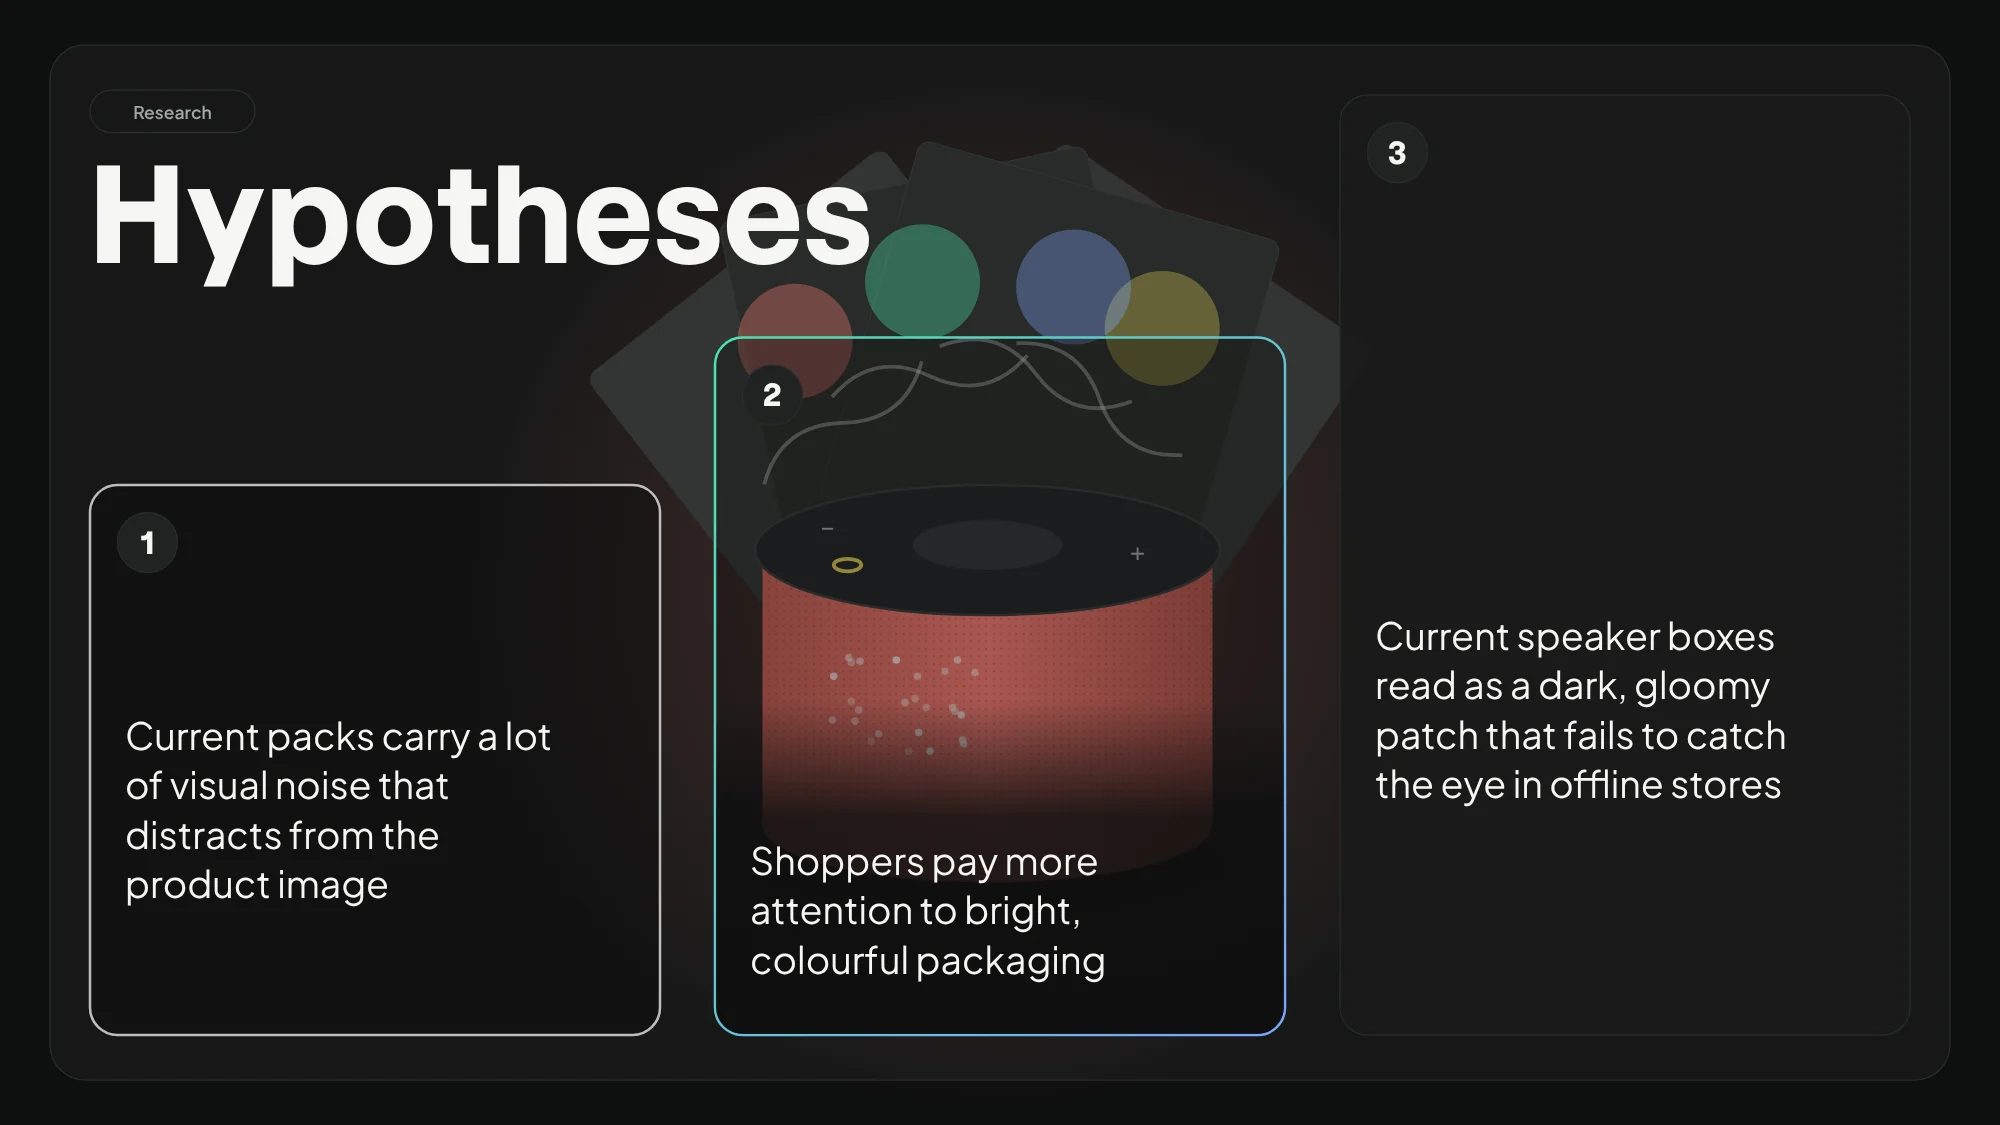
Packaging research for a consumer-device brand
A conference presentation of packaging research: goals, methodology, target audience and conclusions.
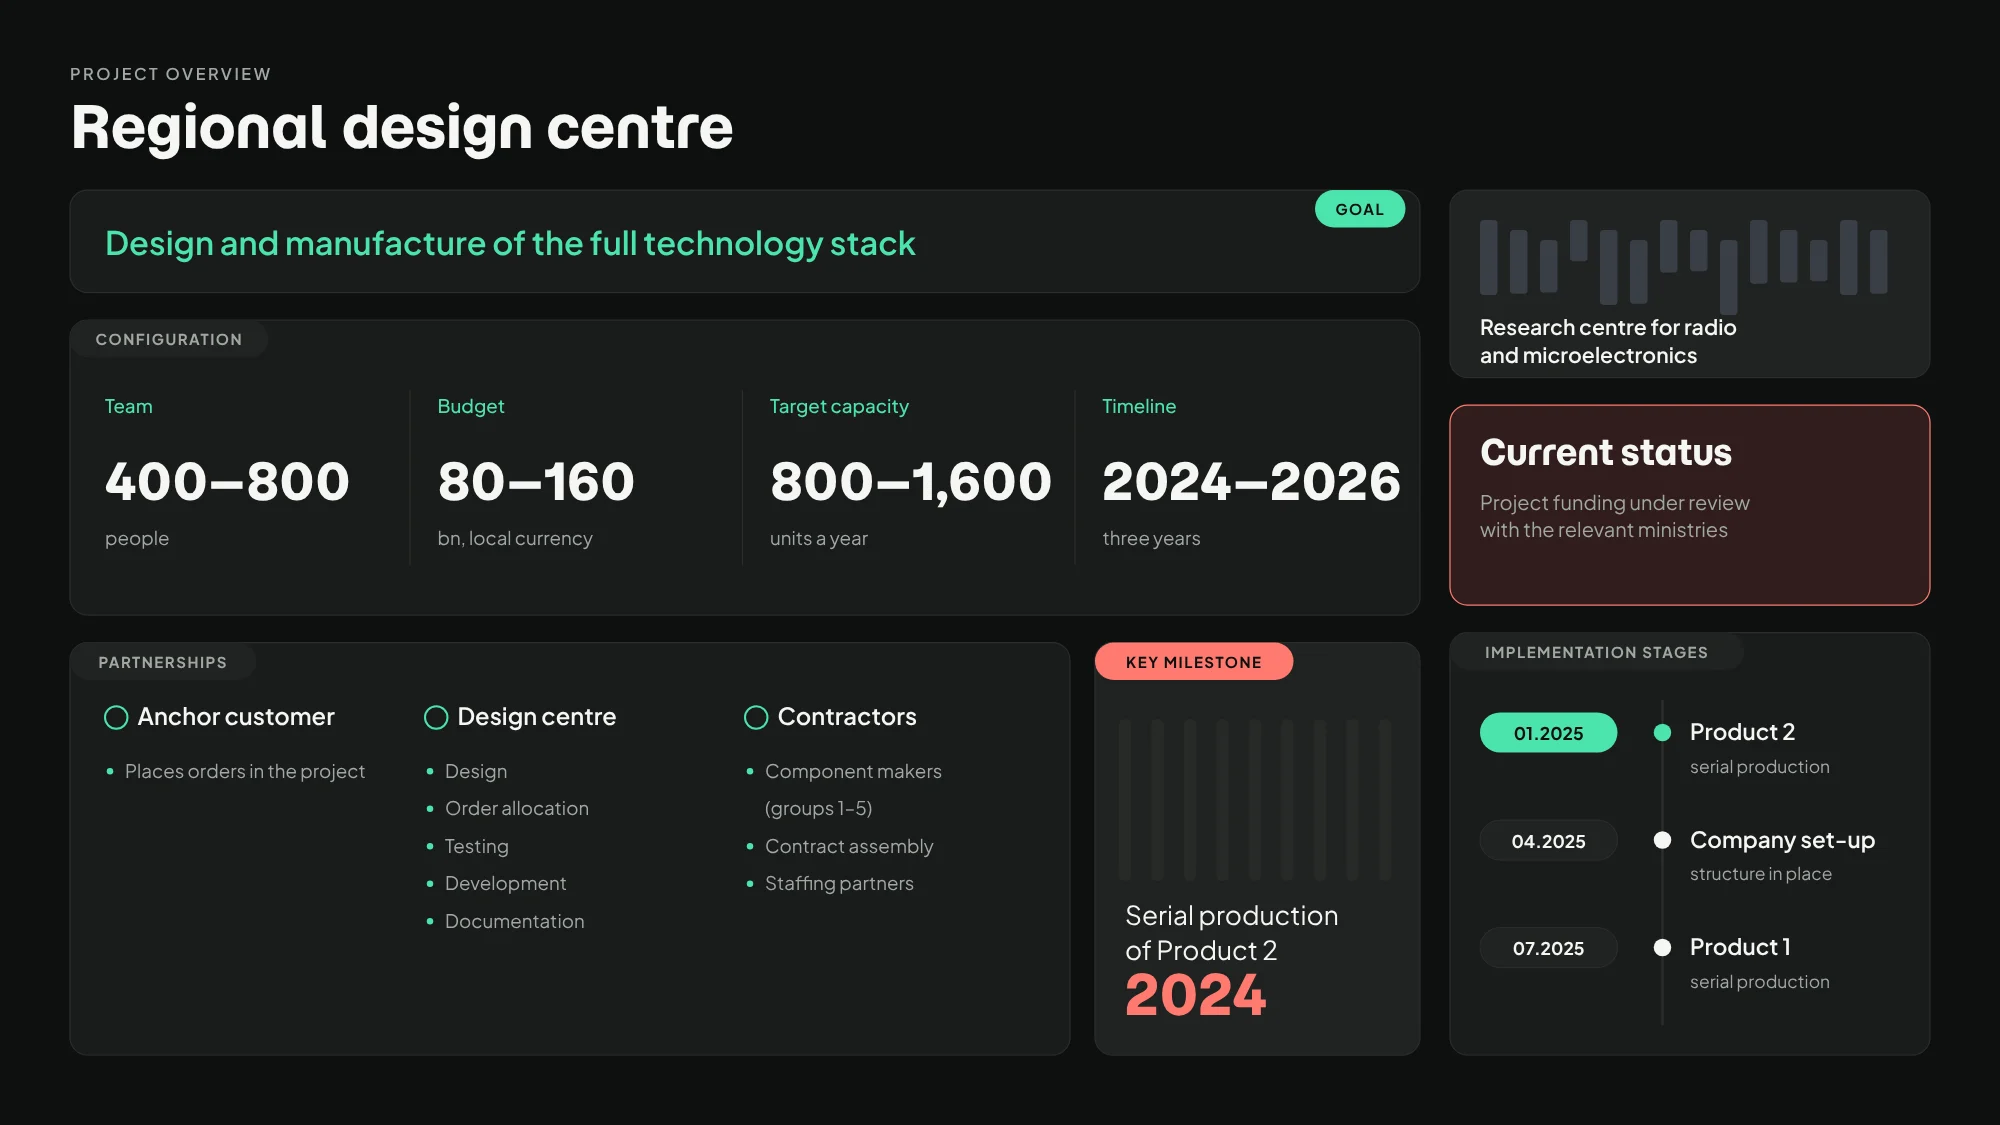
Slide redesign for a microelectronics company
Redesign of corporate slides to reflect a modern company, follow the brand book and fit all master-deck content onto a single slide.
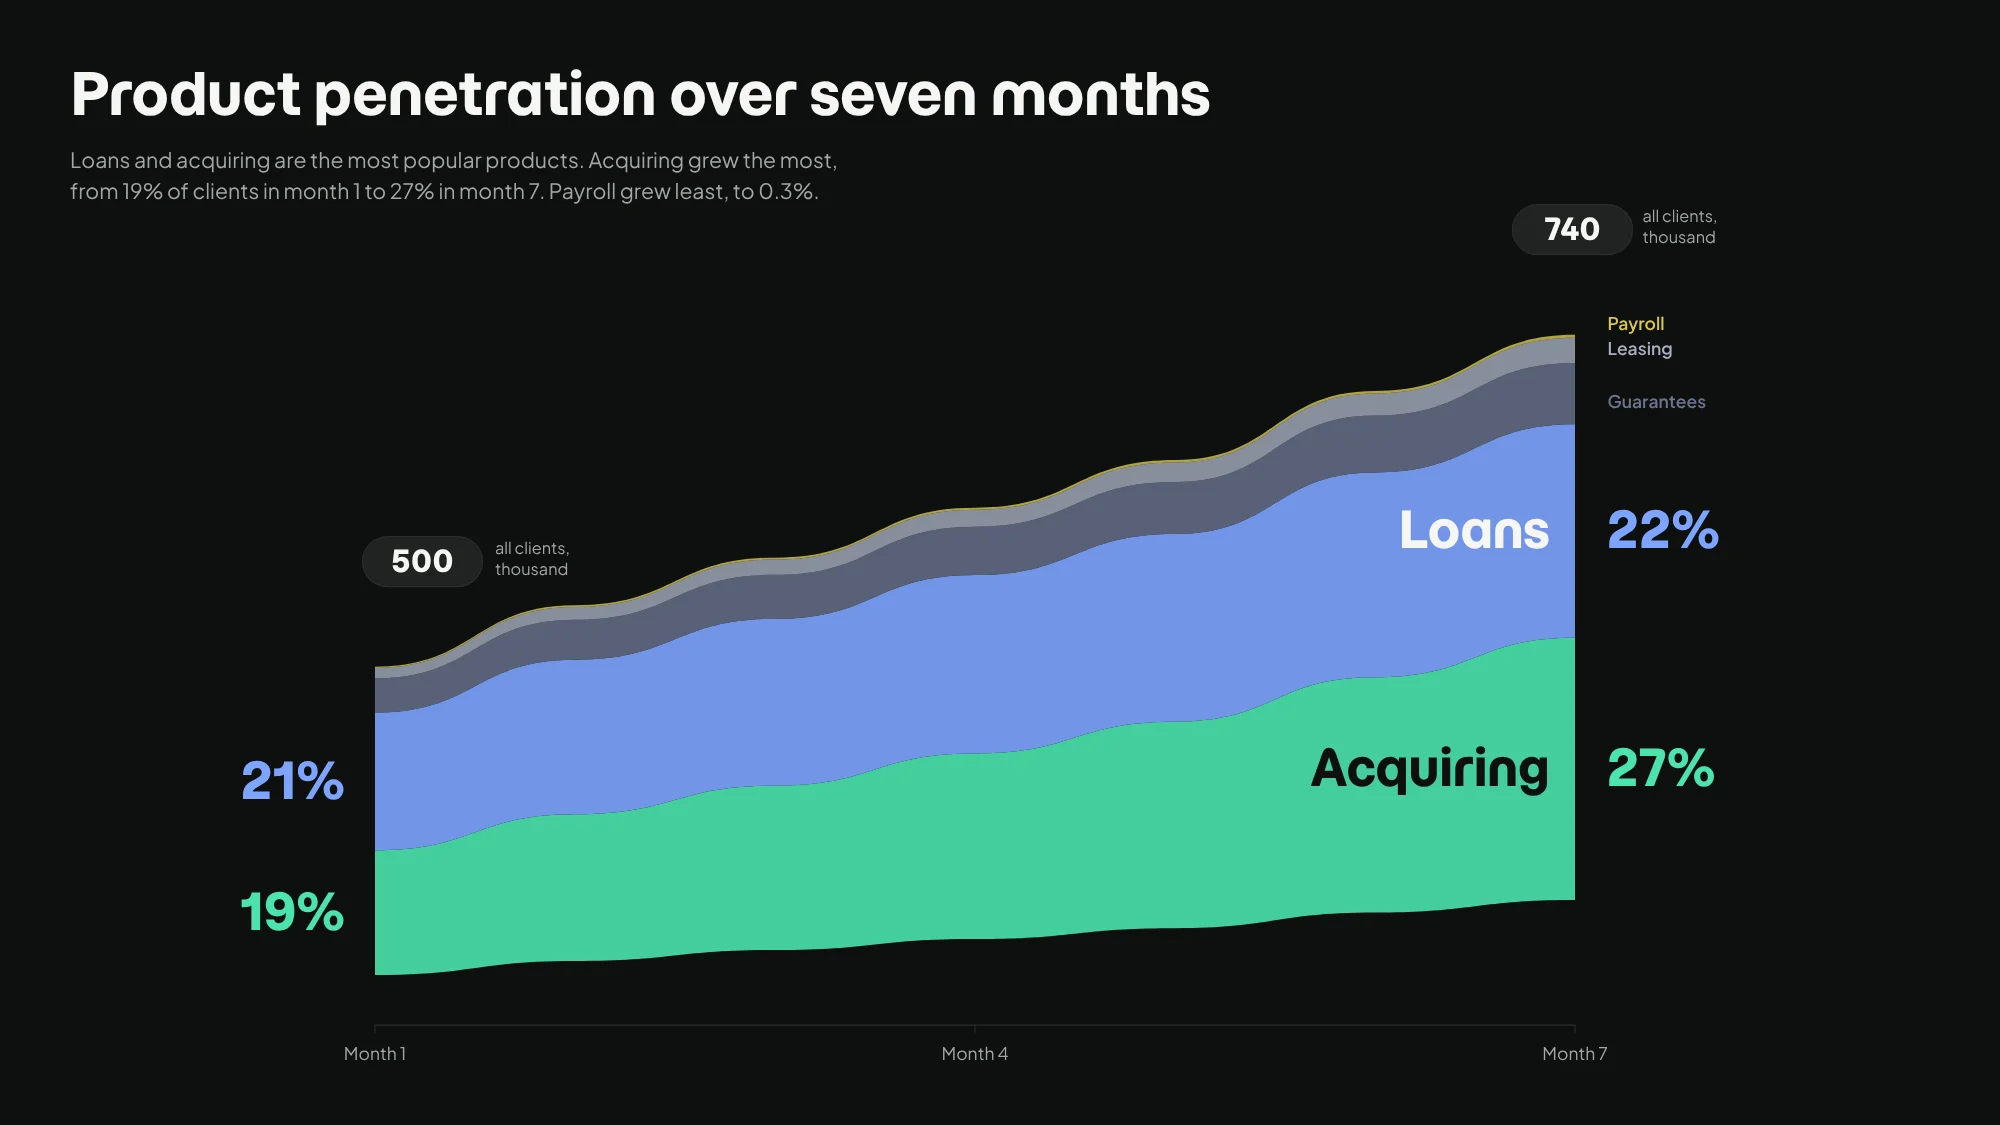
Bank pilot: results for top management
Comprehensive analysis of a bank's pilot project, presented to the bank's top management.
03 · 2 projects
Data visualisation & maps
Charts, infographics and geographic maps on energy, commodities and trade.
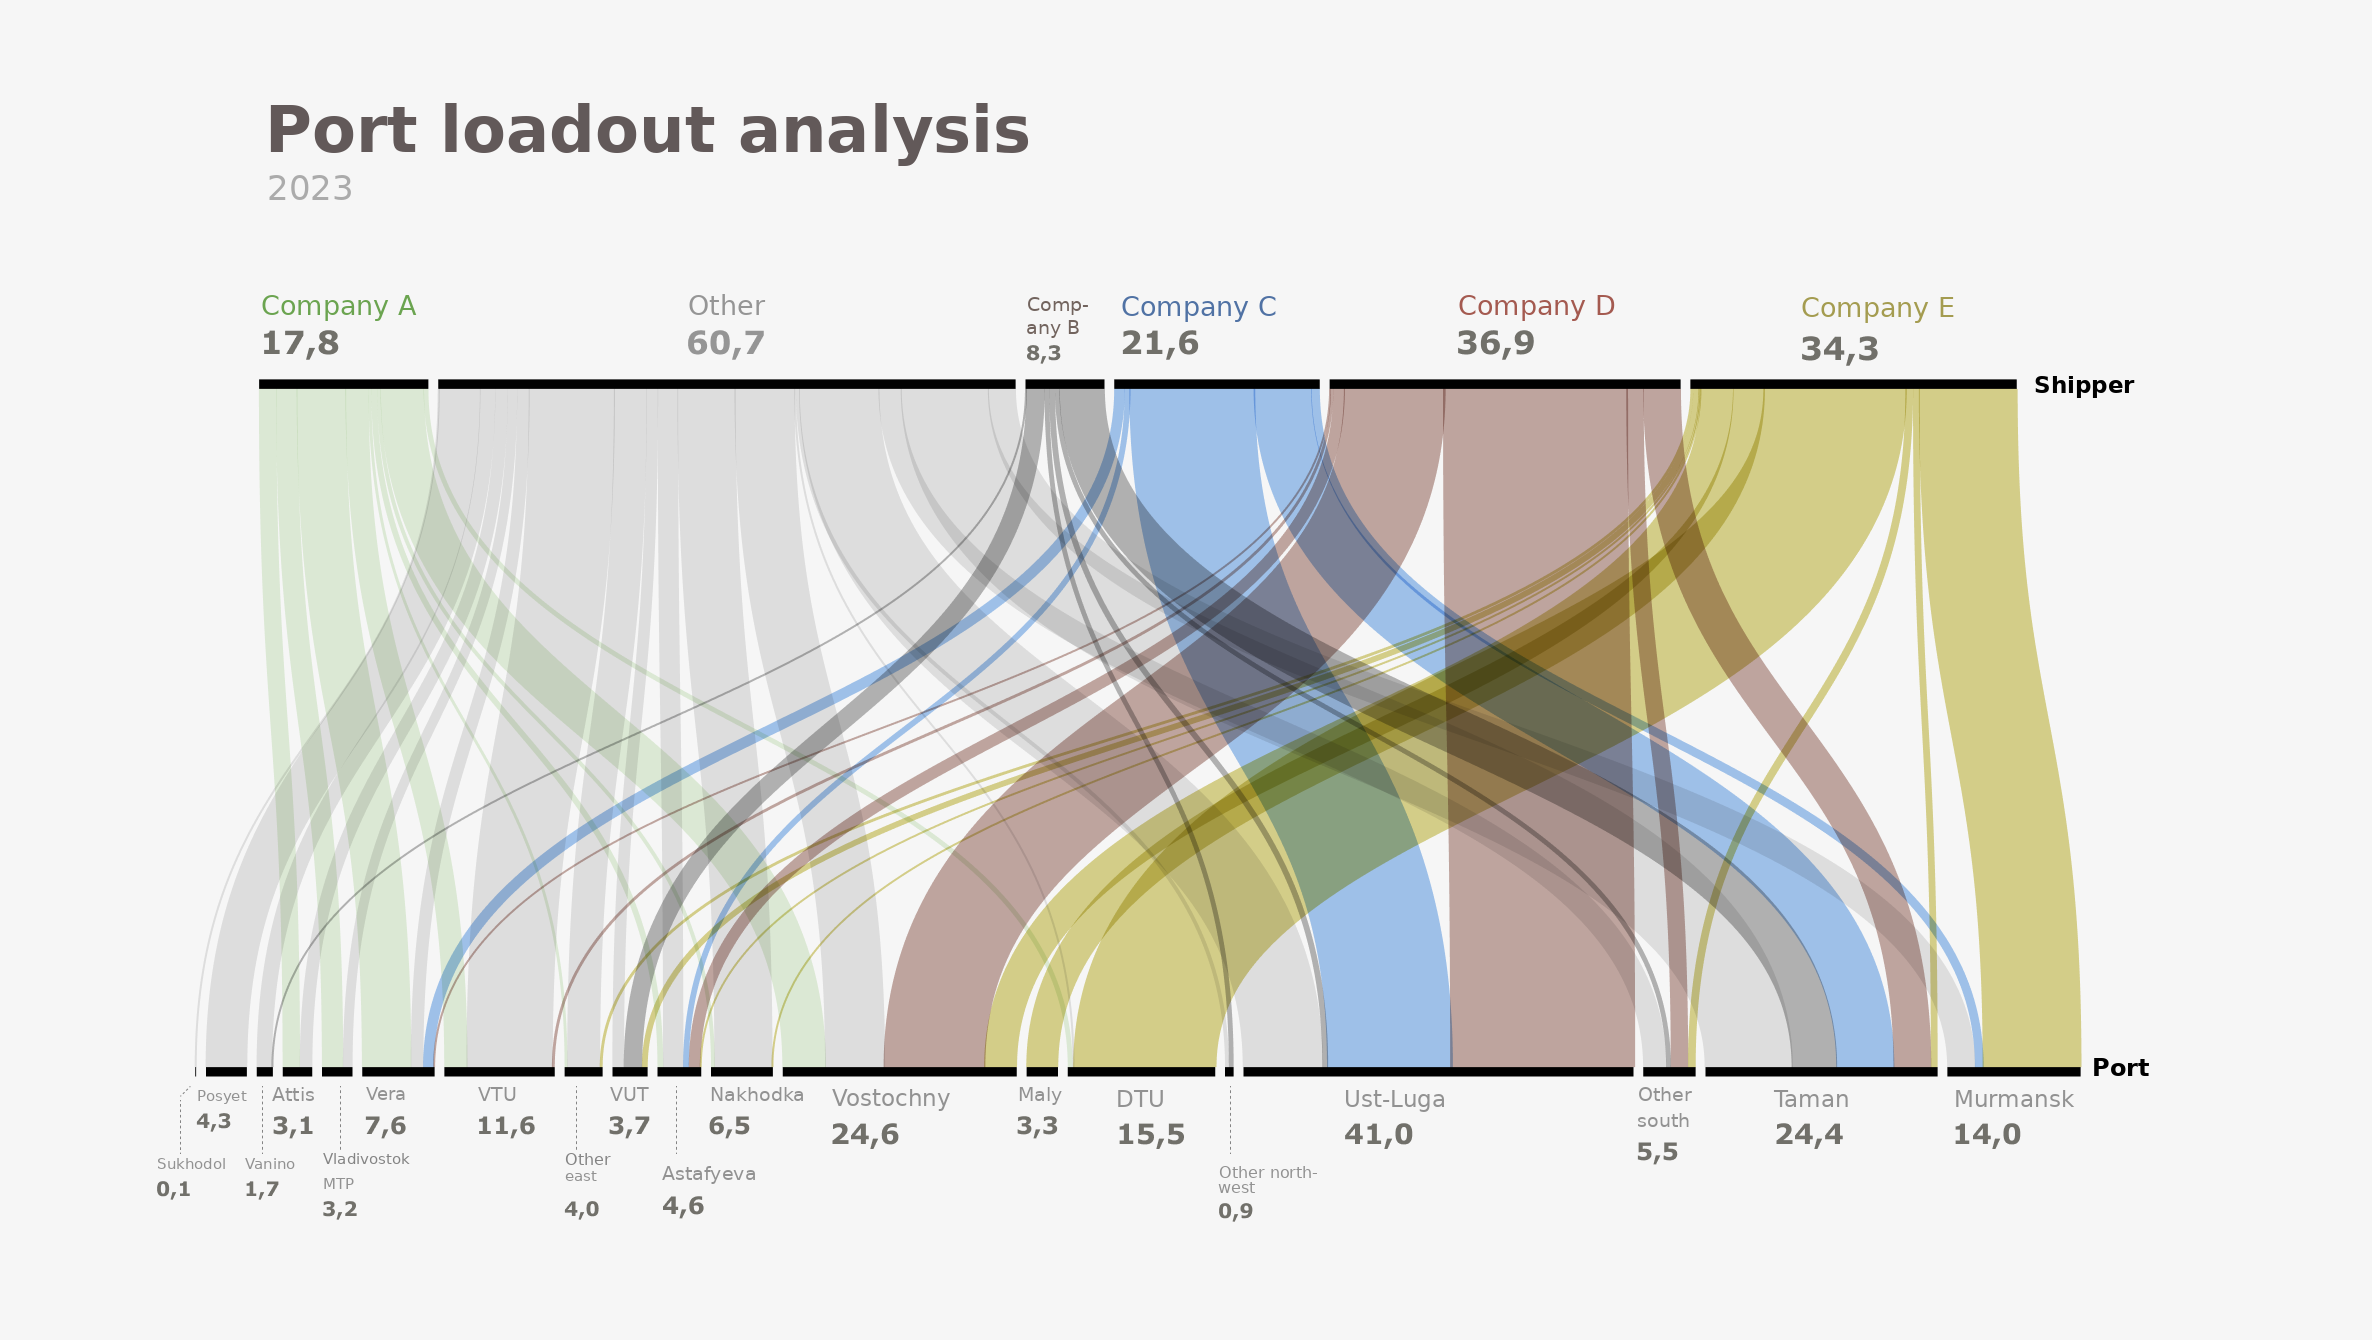
Charts & infographics
A selection of charts and infographics: Sankey flows, chord diagrams, beeswarms, streamgraphs and editorial charts on energy, coal and trade.
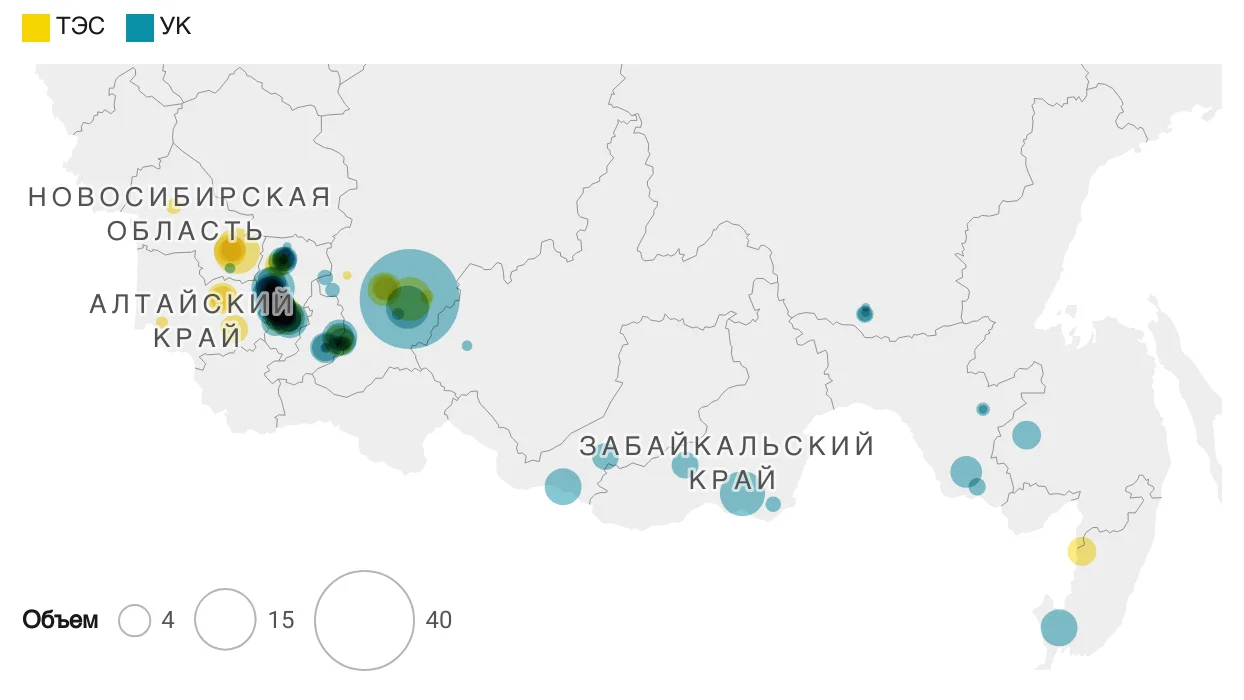
Geo mapping
Relief maps, trade-flow maps and interactive choropleths – from coal power plants to China's net exports by province.
04 · 4 projects
AI-built tools & apps
Interactive data tools prototyped and shipped with AI coding assistants.
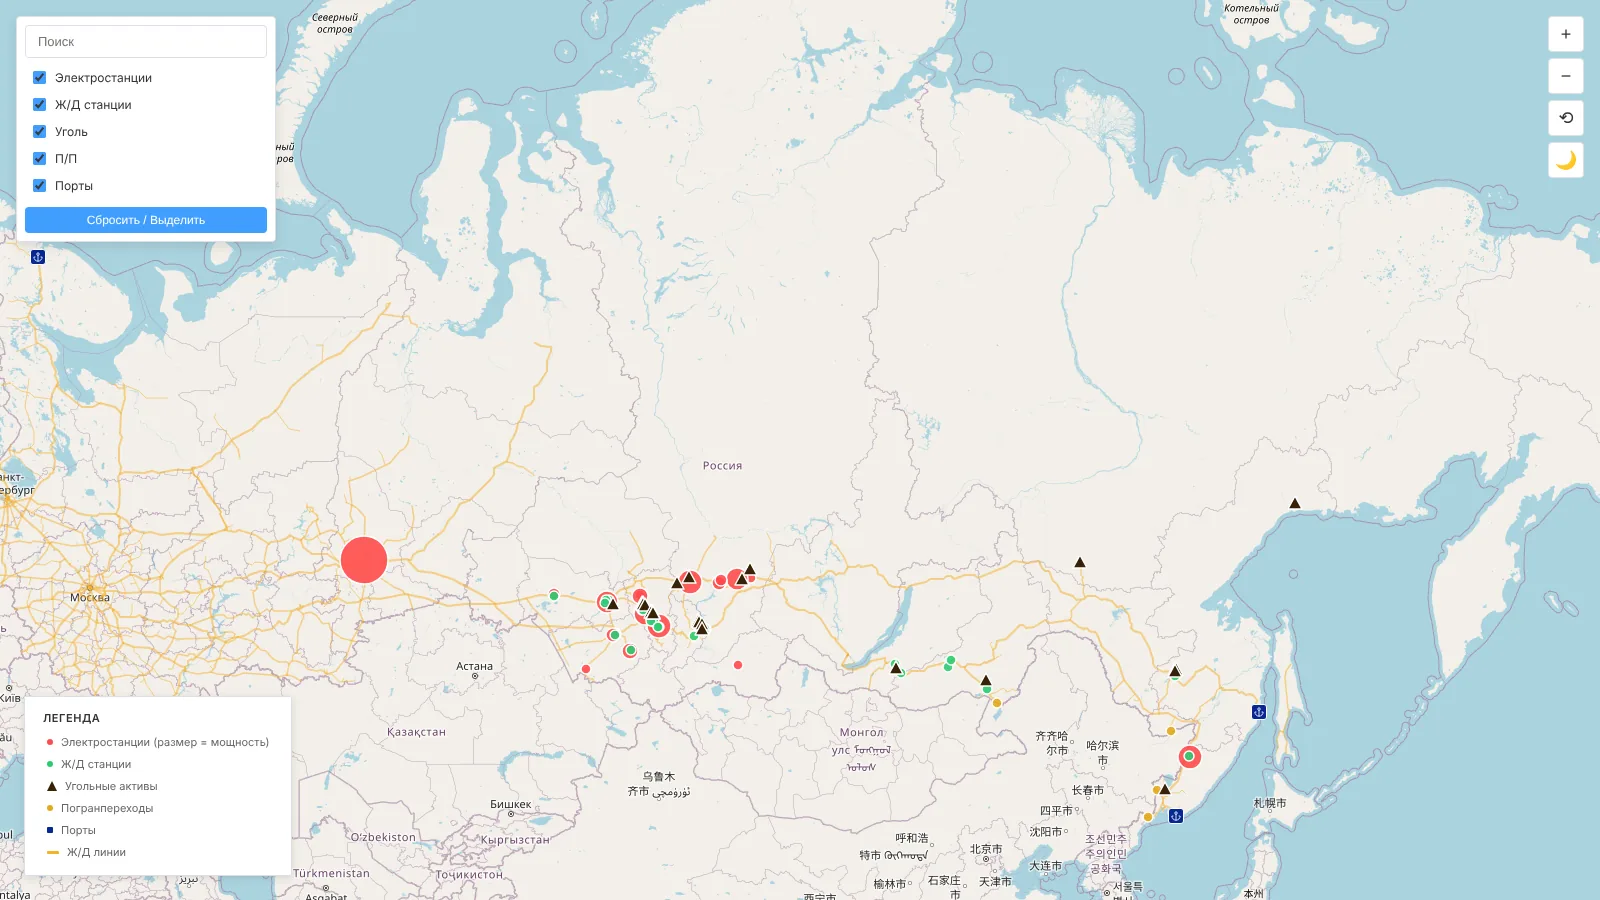
Global infrastructure assets map
A global infrastructure map showing the company's key assets.
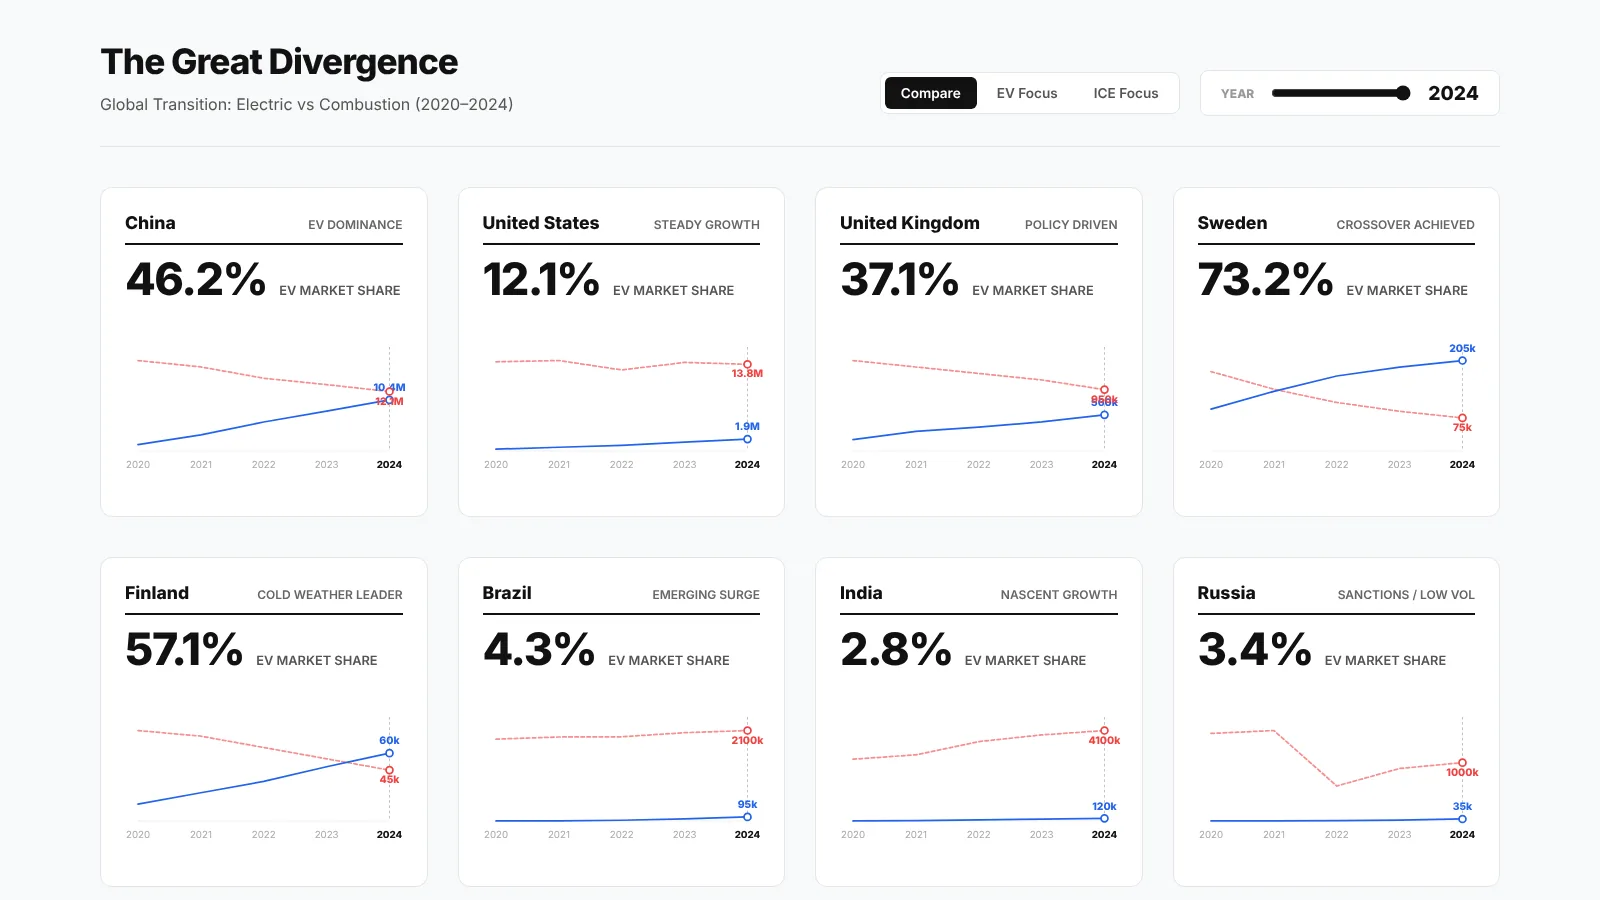
Electric-vehicle dashboard
An interactive dashboard on the electric-vehicle market.
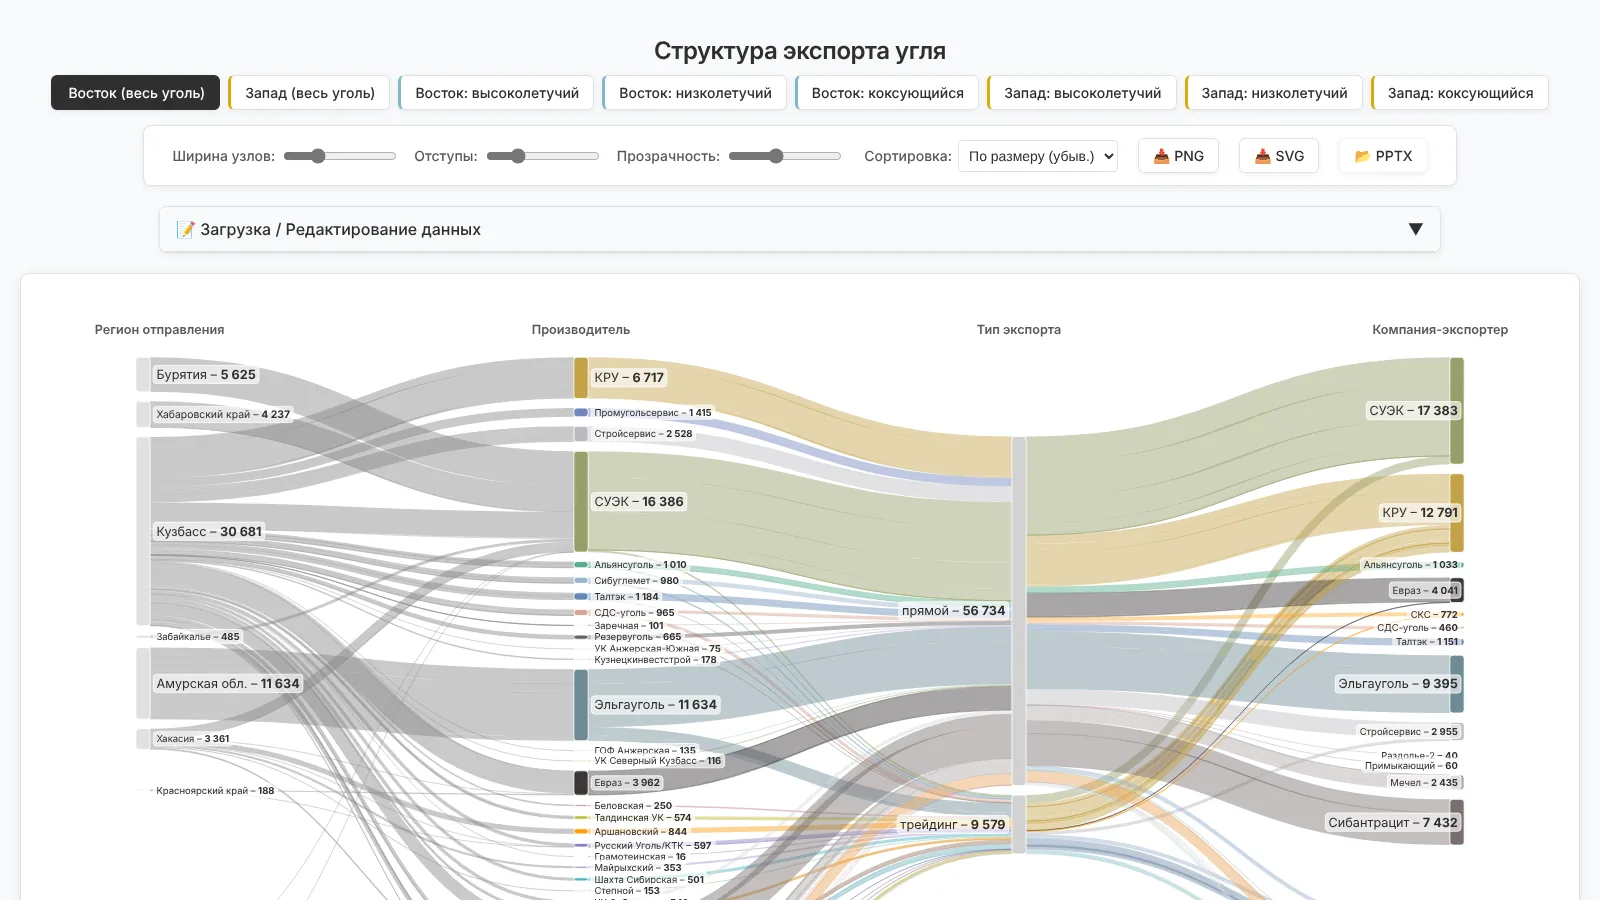
Sankey builder
A utility that aggregates data, builds Sankey diagrams and exports them automatically to vector and raster formats.
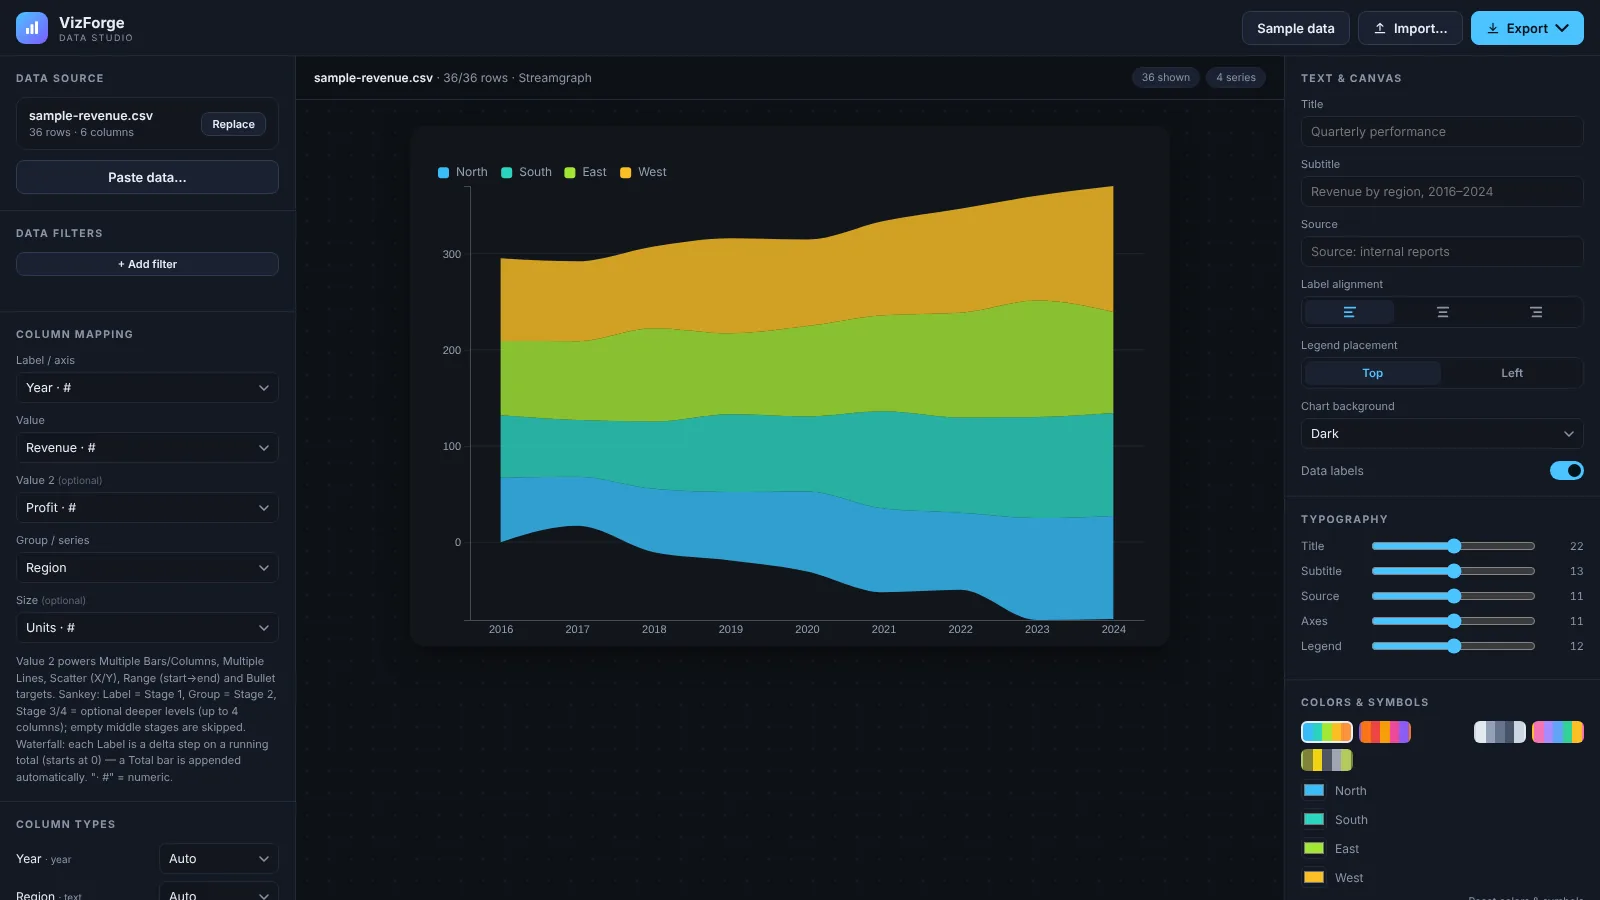
VizForge
A full data-visualisation tool with many chart types, rich styling options and export.