Our work / Dashboards & information systems / Fuel flows to power systems
Automation + viz
Fuel flows to power systems
Automated tracking and visualisation of how fuel moves to, and is consumed by, the company's power systems.
- Client
- Energy
- Direction
- Dashboards & information systems
- Format
- Automation + viz
- Tags
- Energy · Automation
Challenge
Data on how fuel moved to the company's power systems, and how it was consumed there, was collected manually and spread across several sources. Managers lacked a transparent, up-to-date view of fuel flows and the risks around them.
Approach
- Mapped the fuel chain from delivery through storage to consumption by each power system.
- Automated the collection and processing of fuel movement and consumption data.
- Analysed the flows to show where fuel goes and how consumption changes over time.
- Integrated the solution with the company's existing resource-management systems.
What we delivered
- An automated data pipeline for fuel movement and consumption.
- Flow visualisations from source to each power system.
- An implementation scheme showing how the solution connects to existing systems.
Outcome
Automation and visualisation gave transparency and control at every level, made the energy systems more efficient to manage, improved resource management and reduced operational risk.
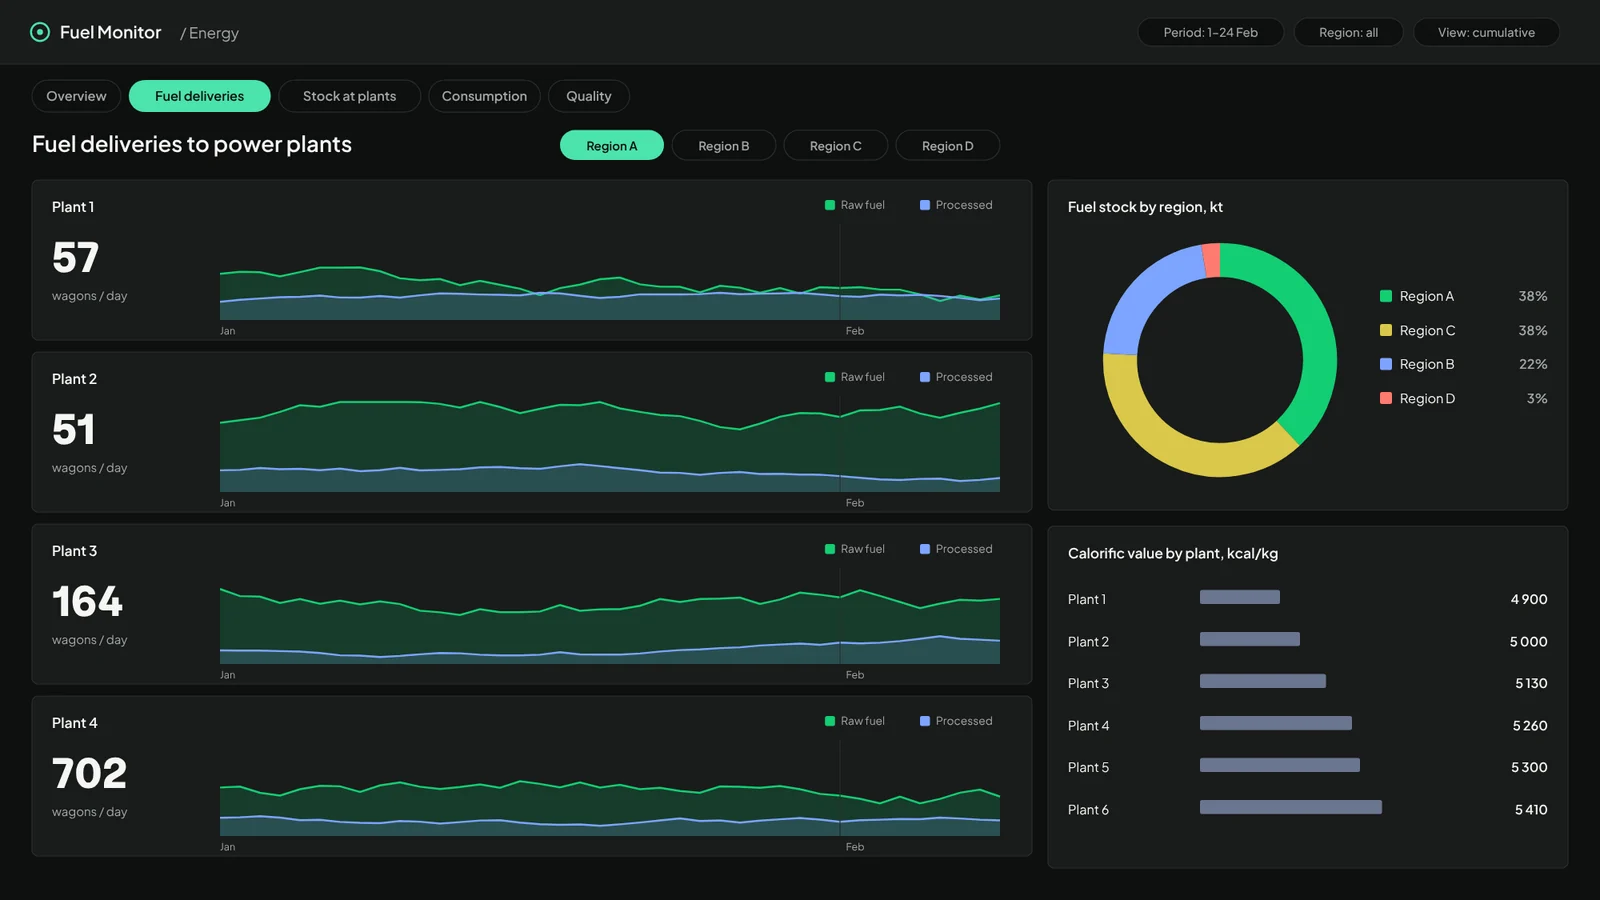
Interface recreated in the hice style. Names, regions and figures are anonymised and altered.
01 Inputs
- Fuel deliveries
- Storage levels
- Consumption by unit
02 Automation
- Data collection
- Processing & checks
- Integration with resource systems
03 Visibility
- Flow diagrams
- Consumption monitoring
- Risk alerts for managers