Our work / Dashboards & information systems / Stocks in Ports
Dashboard
Stocks in Ports
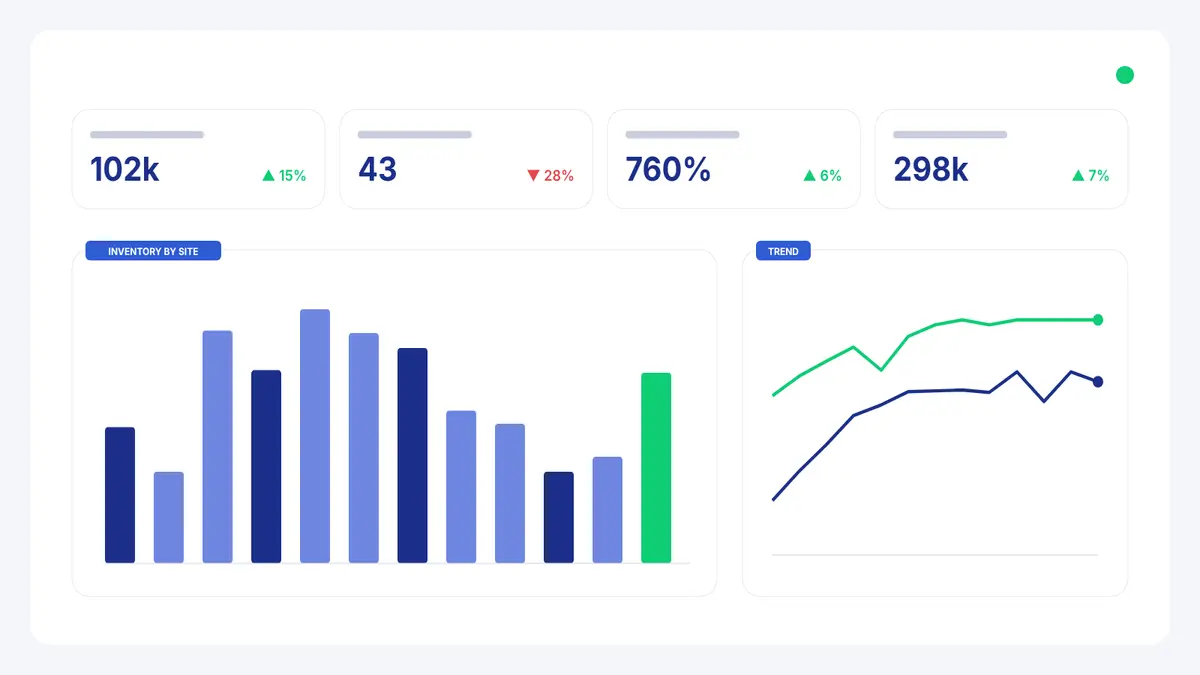
An analytical dashboard giving a complete, accurate picture of inventory held in ports for better planning and resource management.
- Client
- Logistics
- Direction
- Dashboards & information systems
- Format
- Dashboard
- Tags
- Logistics · Data consolidation
Challenge
Inventory held in ports was reported separately by each site, in different formats and on different schedules. Planners had no single, reliable picture of what was where, which made it hard to plan shipments and allocate resources.
Approach
- Audited the data each port site produced and agreed one common structure for stock records.
- Collected and consolidated data from every site and source into a single dataset.
- Cleaned and standardised the records so figures from different ports could be compared directly.
- Designed the dashboard around the questions planners ask every week: how much, where, and how it is changing.
What we delivered
- A consolidated stock dataset covering all port sites.
- An analytical dashboard with an overview across ports and drill-down to each site.
- A documented data blueprint showing how data moves from source to dashboard.
Outcome
Consolidated data improved the quality of analytics and sped up business-intelligence work. Logistics and supply-chain teams gained a shared view for strategic planning instead of reconciling site reports by hand.
Sample testimonial“For the first time we see stock across every port in one place. Weekly planning that used to take two days of spreadsheet work now takes an hour.”
— Head of supply-chain planning, logistics company
01 Sources
- Port site reports
- Warehouse records
- Shipment data
02 Consolidation
- Collection from every site
- Cleaning & single format
- Unified stock dataset
03 Dashboard
- Stock across all ports
- Drill-down by site
- Trends for planning